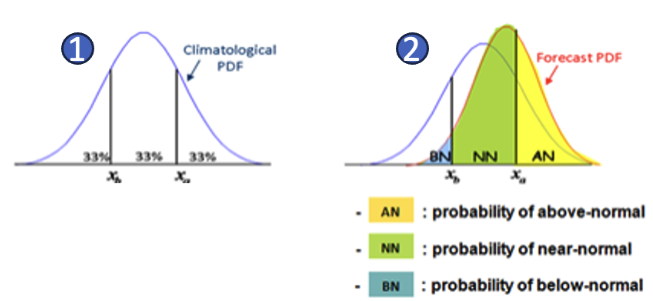
The forecasts charts show the probability of the most likely tercile of the distribution:
Probabilities are estimated by comparing the forecast probability density function (PDF) with the corresponding model climate PDF, estimated from the hindcast set (1993-2016). The probabilities are stratified according to the lower/upper/middle third of the model climate distribution.
As an overview to the seasonal forecast, a summary plot is presented for tercile categories: it shows in a single figure the areas which have an increased probability (exceeding 40%) of being either below the lower tercile or above the upper tercile.